
EPD Guide
EPD Basics
Expected progeny differences (EPDs) are a useful tool for cattle producers to develop a commercial or purebred herd. We provide EPD information for all our available bulls to help you find the best animal for your needs.
EPDs are a prediction of how a bull’s progeny will perform in certain traits compared to other calves within the breed. These predictions extrapolate from past performance data submitted to breed associations. They cannot estimate actual values, only differences.
The figure in parentheses found after each EPD is an accuracy value. Accuracy is the difference between an animal’s actual progeny performance and the predicted value. The higher the number, the greater the accuracy. Accuracy gets better as progeny data accumulates.
Accuracy scores are important when comparing animals of varying ages or looking at pedigrees. However, oftentimes the animal you are looking at is young, has no progeny, and therefore will have low-accuracy EPDs.
EPDs help cattle producers select animals to add to or cull from their herd. Your goals and objectives will inform which EPDs to prioritize. For example, let’s say you want to increase weaning weight within your herd. The weaning weight (WW) EPDs for Bull A and Bull B are 37 lb. and 56 lb. respectively, and their accuracies are about the same. So, on average Bull B will sire a calf that will weigh, at weaning age, 19 lb. (56-37=19) heavier than a calf sired by Bull A when bred to a similar set of cows.
Next, compare those values to the sire percentile summary. This chart allows you to determine if an individual EPD score is “good” within the breed. It turns out that Bull B is in the top 10% for weaning weight within the breed. Great! That indicates he would be a good choice to optimize weaning weight in your herd.
Make sure to note of all of a bull’s EPDs before making a purchase and look for an animal that complements your existing herd. Avoid excessive single-trait selection, which leads to unhealthy extremes and genetic bottlenecks.
Understanding Hereford EPDs
The American Hereford Association currently produces EPDs for 15 traits and calculates four profit indexes. Research is ongoing to develop additional traits. DNA-marker tests enhance the accuracy of Hereford EPDs.
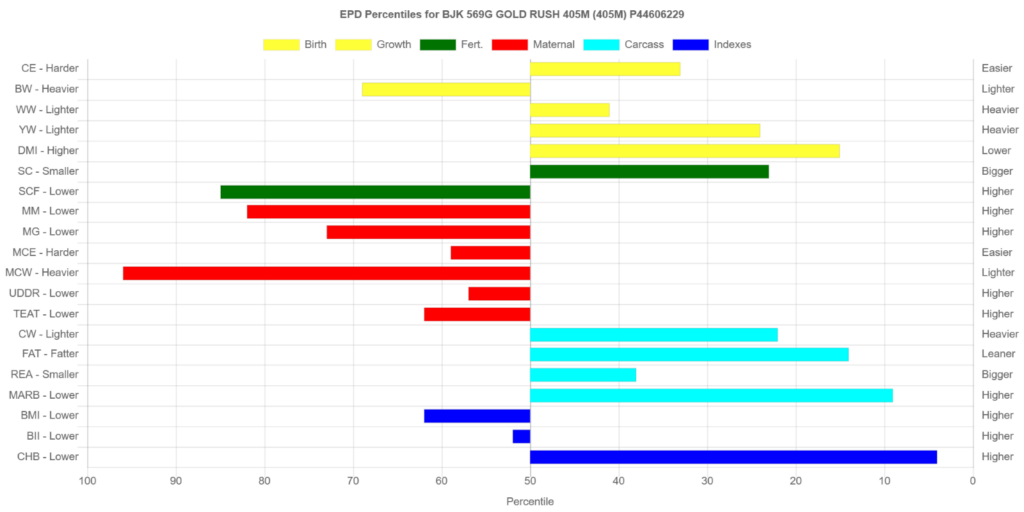
Each animal is scored against these traits and the data is represented as a chart of percentiles above and below average. The 50th percentile is the breed average EPDs for the previous year. Values shown on the right are preferred (eg, Calving Ease = Easier, Mature Cow Weight = Lighter, Carcass Weight = Heavier).

CE predicts the probability that a sire’s progeny will be born unassisted to two-year-old heifers. It incorporates both birth weights and calving ease (scored from 1 = unassisted birth to 4 = Cesarian section, with additional categories for abnormal position or stillbirth.) For example, if sire A has a CE EPD of 6% and sire B has a CE EPD of -2%, then you would expect on average if comparably mated, sire A’s calves would have an 8% greater chance of unassisted birth when compared to sire B’s calves.
Calving Ease is negatively correlated with Birth Weight (BW), because higher birth weights cause a significant percentage of calving difficulty in first-calf heifers. For best results, prioritize high CE values over BW values as CE already incorporates BW into its calculation.
Learn more about calving ease here.
BW is measured in pounds. If sire A has a BW EPD of 3.6 and sire B has a BW EPD of 0.6, then you would expect on average if comparably mated, sire A’s calves would be 3 lb. heavier at birth when compared to sire B’s calves.
Birth Weight is negatively correlated with Calving Ease (CE), because higher birth weights are a primary cause of calving difficulty in first-calf heifers. For best results, prioritize high CE values over low BW as CE already incorporates BW into its calculation.
Birth Weight and Weaning Weight (WW) are positively correlated, because cattle bred for explosive growth often have heavier weights at all stages of life, including birth. Breeders look for “curve-bender” bulls that break this correlation—sires with low birth weight EPDs but high weaning weight EPDs.
WW EPD is an estimate of pre-weaning growth that is measured in pounds. For example, if sire A has a WW EPD of 60 and sire B has a WW EPD of 40, then you would expect on average if comparably mated, sire A’s calves would weigh 20 lb. heavier at weaning when compared to sire B’s calves.
YW EPD is an estimate of post-weaning growth that is measured in pounds. For example, if sire A has a YW EPD of 100 and sire B has a YW EPD of 70, then you would expect on average if comparably mated, sire A’s calves would weigh 30 lb. heavier at a year of age when compared to sire B’s calves.
The milking ability of a sire’s daughters is expressed in pounds of calf weaned. It predicts the difference in average weaning weights of sires’ daughters’ progeny due to milking ability. Daughters of the sire with a +14 MM EPD should produce progeny with 205-day weights averaging 24 lb. more (as a result of greater milk production) than daughters of a bull with a MM EPD of -10 lb. (14 minus -10.0 = 24 lb.). This difference in weaning weight is due to total milk production during the entire lactation.
Maternal Milk & Growth reflects what the sire is expected to transmit to his daughters for a combination of growth genetics through weaning and genetics for milking ability. It is an estimate of daughters’ progeny weaning weight. A bull with a 29 lb. M&G EPD should sire daughters with progeny weaning weights averaging 19 lb. heavier than progeny of a bull’s daughters with a M&G EPD of 10 lb. (29 minus 10 = 19 lb.). It is equal to one-half the sire’s weaning weight EPD, plus all of his MM EPD. No accuracy is associated with this since it is simply a mathematical combination of two other EPDs. It is sometimes referred to as “total maternal” or “combined maternal.”
MCE EPD predicts how easily a sires daughters will calve at 2 years of age and is measured on a percentage. For example, if sire A has a MCE EPD of 7 and sire B has a CE EPD of -3, then you would expect on average if comparably mated, sire A’s daughters would calve with a 10% more likely chance of being unassisted when compared to sire B’s daughters.
The MCW EPD was designed to help breeders select sires that will either increase or decrease mature size of cows in the herd. The trait was developed after years of cow weight data collection and the EPD relates directly to the maintenance requirements of a cow herd. For example, if sire A has a MCW EPD of 100 and sire B has an EPD of 85, then you would expect the females of sire A, if mated to similar cows, to be 15 lb. heavier at mature size.
UDDR EPDs are reported on a 9 (very tight) to 1 (very pendulous) scoring scale. Differences in sire EPDs predict the difference expected in the sires’ daughters’ udder characteristics when managed in the same environment. For example, if sire A has a UDDR EPD of 0.4, and sire B has a UDDR EPD of -0.1, the difference in the values is 0.5, or one-half of a score. If daughters of sires A and B are raised and managed in the same environment, you would expect half a score better udder suspension in daughters of sire A, compared to sire B.
TEAT EPDs are reported on a 9 (very small) to 1 (very large, balloon shaped) scoring scale. Differences in sire EPDs predict the difference expected in the sires’ daughters’ udder characteristics when managed in the same environment. For example, if sire A has a teat size EPD of 0.4, and sire B has a teat size EPD of -0.1, the difference in the values is 0.5, or one-half of a score. If daughters of sires A and B are raised and managed in the same environment, you would expect half a score smaller teat size in daughters of sire A, compared to sire B.
Measured in centimeters and adjusted to 365 days of age, SC EPD is the best estimate of fertility. It is related to the bull’s own semen quantity and quality, and is also associated with age at puberty of sons and daughters. Larger SC EPDs suggest younger age at puberty. Yearling sons of a sire wth a .7 SC EPD should have yearling scrotal circumference measurements that average 0.7 centimeters (cm) larger than progeny by a bull with an EPD of 0.0 cm.
Sustained Cow Fertility EPD (SCF) is a prediction of a cow’s ability to continue to calve from three years of age through twelve years of age, given she calved as a two-year-old. The EPD is expressed as a deviation in the proportion of the ten-possible calving’s to twelve years old expressed as a probability. For example, the daughters of a bull with a 30 EPD would have the genetic potential to have one more calf by age twelve then the daughters from a bull with a 20 EPD. In other words, the daughters from the 30 EPD bull would have a 10% greater probability of having one more calf than the bull with a 20 EPD. This is equivalent to saying that the daughters are 10% more likely to remain in the herd to age 12.
This EPD is new as of 2017. Learn more here.
The Dry Matter Intake EPD predicts the daily consumption of pounds of feed. For example, if sire A has a DMI EPD of 1.1 and sire B has a DMI EPD of 0.1, you would expect sire B’s progeny, if comparably mated, to consume on average 1 pound of feed less per day.
Carcass weight is a beneficial trait when considering the impact that pounds have relative to end product value. At the same age constant endpoint, sires with higher values for carcass weight will add more pounds of hot carcass weight compared to sires with lower values for carcass weight. For example, if sire A has a CW EPD of 84 and sire B has a CW EPD 64, then you would expect the progeny of sire A, if harvested at the same age constant endpoint, to have a 20-lb. advantage in terms of hot carcass weight.
The FAT EPD reflects differences in adjusted 365-day, 12th-rib fat thickness based on carcass measurements of harvested cattle. Sires with low, or negative FAT EPDs are expected to produce leaner progeny than sires with higher EPDs. Ultrasound measures are also incorporated into this trait and have been shown to be highly correlated with the performance of slaughter progeny. All data is expressed on a carcass scale.
REA EPDs reflect differences in an adjusted 365-day ribeye area measurement based on carcass measurements of harvested cattle. Sires with relatively higher REA EPDs are expected to produce bettermuscled and higher percentage yielding slaughter progeny than will sires with lower REA EPDs. Ultrasound measurements are also incorporated into this trait and have been shown to be highly correlated with the performance of slaughter progeny. All data is expressed on a carcass scale.
MARB EPDs reflect differences in an adjusted 365-day marbling score (intramuscular fat, [IMF]) based on carcass measurements of harvested cattle. Breeding cattle with higher MARB EPDs should produce slaughter progeny with a higher degree of IMF and therefore higher quality grades. Ultrasound measurements are also incorporated into this trait and have been shown to be highly correlated with the performance of slaughter progeny. All data is expressed on a carcass scale.
BMI$ is a maternally focused index that has a production system based on 1,000-Hereford x Angus females with a progeny harvest endpoint directed toward Certified Hereford Beef (CHB®). This index is more critical of CE than the Brahman Influence Index (BII$) and also has significant weight on fertility. There is positive weight on WW and a slightly negative weight on YW, which promotes early growth and then a slow down on growth to keep mature size manageable. The emphasis of IMF is greater than the emphasis of REA. This is true because of the price difference of the Choice-Select spread and the fact that there is very little incentive to produce cattle better than a Yield Grade 3. This index is geared to service any commercial program that has British-cross cows.
This is a general purpose index that focuses on identifying bulls that can be used on heifers and then ultimately the calves will be marketed through the CHB program. As you might expect, CE and MCE carry significant weight in this index along with fertility. There is very little weight put on growth traits and less emphasis on carcass. Remember, this is a general index that is specifically designed to be used in a heifer program.
BII$ is a maternally focused index that is based on a 1,000-head cow herd of Brahman x Hereford cows. The progeny for this index will be harvested in a commodity-based system since CHB does not accept Brahman-influenced cattle into the program. This index has less emphasis for CE than any of the other indexes. There is emphasis on both REA and IMF since the cattle will be harvested through a commodity market. The largest emphasis is in fertility, which is measured solely by SC at the present time. Obviously, the target for this index is the producers in the Southern regions of the U.S. where the bulls are typically sold to commercial cattlemen that have Brahman-influenced cow herds.
This is a terminal sire index that is built on a production system where Hereford bulls sire calves for the CHB market. There is some pressure put on CE and then positive weight on both WW and YW. Remember that all offspring in this index are harvested, so they need to be born alive and then grow fast at all stages of life. Of course, we have much more emphasis on fat in this index, as we want the cattle to stay lean. There is also a significant weight on both REA and IMF with more emphasis again on IMF. This index would be used by producers who have a target of producing bulls for a terminal breeding program. It could be used heavily in the Midwest where bulls are used in rotational breeding programs to produce cattle in a retained ownership program or are simply sold to backgrounders. This is the only index that has no emphasis on fertility. Remember that nothing is retained in the herd.
The American Hereford Association (AHA) has embraced the use of genomics into their genetic evaluation by launching a first of its kind single step analysis that utilizes the marker effects of specific traits. Likewise, AHA is directly estimating accuracy values rather than approximating. The direct estimation of accuracy results in a more conservative value but a more accurate value than previous methodologies. The AHA is producing the most reliable genetic evaluation that is supported by Whole Herd TPR™ and genomics, which will give prospective buyers added confidence in purchasing young and unproven animals.
Buying animals that have a genomic profile incorporated into their Expected Progeny Difference (EPD) offers increased accuracy, allowing for quicker breed and herd improvement. Learn more here.
Adapted from Understanding Hereford EPDs Fact Sheet, the American Hereford Association, and EPD Basics by Evan Whitley.